RabbitFarm
2021-12-13
Constructing a Plot in gnuplot Using Gnu Prolog
Part 1
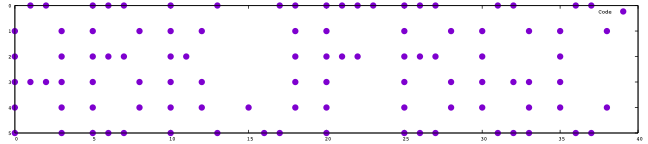
Advent of Code 2021 Day 13, in summary, involves the simulation of folding a transparent piece of paper. When "folded" properly a correct solution yields points which when plotted reveal a code which is the solution to a puzzle!
Not wanting to spend too much time on plotting I first considered dumping the points to a
file and then using a plotting program like gnuplot directly. In the spirit of having a
complete self-contained solution, however, I explored what could be done be interfacing
with gnuplot using GNU Prolog's popen/3. This worked very well!
Solution
:-dynamic(dots/1).

:-initialization(main).

check_and_read(10, [] ,_):-
    !.
check_and_read(13, [], _):-
    !.
check_and_read(32, [], _):-
    !.
check_and_read(44, [], _):-
    !.
check_and_read(end_of_file, [], _):-
    !.
check_and_read(Char, [Char|Chars], Stream):-
    get_code(Stream, NextChar),
    check_and_read(NextChar, Chars, Stream).

read_data(Stream, []):-
    at_end_of_stream(Stream).
read_data(Stream, [X|L]):-
    \+ at_end_of_stream(Stream),
    get_code(Stream, Char),
    check_and_read(Char, Chars, Stream),
    atom_codes(X, Chars),
    read_data(Stream, L).

gnuplot_command(Command, PlotStream):-
    repeat,                           % START REPEAT
    length(Command, CommandLength),
    between(1, CommandLength, N),
    nth(N, Command, CommandCode),
    put_code(PlotStream, CommandCode),
    N  == CommandLength,              % END REPEAT
    nl(PlotStream).

plot_configuration(PlotStream):-
    popen('/usr/pkg/bin/gnuplot', 'write', PlotStream),
    gnuplot_command("set terminal postscript eps size 9, 2 enhanced color font 'Courier, 11'", PlotStream),
    gnuplot_command("set output '13.eps'", PlotStream),
    gnuplot_command("set yrange [:] reverse", PlotStream),
    gnuplot_command("plot '-' u 1:2 t 'Code' with points pointtype 7 pointsize 2", PlotStream).

plot_dots(PlotStream):-
    findall(_,(
        dots(X-Y),
        atom_codes(X, CodesA),
        atom_codes(Y, CodesY),
        append(CodesA, [32|CodesY], DataCodes),
        length(DataCodes, CodesLength),
        findall(_,(
            between(1, CodesLength, N),
            nth(N, DataCodes, DataCode),
            put_code(PlotStream, DataCode)
        ),_),
        nl(PlotStream)
    ), _).

plot:-
    plot_configuration(PlotStream),
    plot_dots(PlotStream),
    [Exit] = "e",
    put_code(PlotStream, Exit),
    nl(PlotStream),
    close(PlotStream).

make_transparency(Records, Folds):-
    make_transparency(Records, [], Folds).
make_transparency([], Folds, Folds).
make_transparency([fold, along, Fold|Records], FoldAccum, Folds):-
    make_transparency(Records, [Fold|FoldAccum], Folds).
make_transparency([H|Records], FoldAccum, Folds):-
    atom_codes(H, C),
    C \== [],
    append([Y], Rest, Records),
    asserta(dots(H-Y)),
    make_transparency(Rest, FoldAccum, Folds).
make_transparency([H|Records], FoldAccum, Folds):-
    atom_codes(H, C),
    C == [],
    make_transparency(Records, FoldAccum, Folds).

fold_up(Line):-
    findall(Yn, (dots(X-Y), number_atom(Yn, Y)), Yns),
    max_list(Yns, MaxY),
    Half is div(MaxY, 2),
    number_atom(LineN, Line),
    findall(_,(
        dots(X-Y),
        number_atom(Yn, Y),
        Yn > LineN,
        Y0 is LineN - Yn + Half,
        number_atom(Y0, Ya),
        retract(dots(X-Y)),
        retractall(dots(X-Ya)),
        asserta(dots(X-Ya))
    ), _).

fold_left(Line):-
    findall(Xn, (dots(X-Y), number_atom(Xn, X)), Xns),
    max_list(Xns, MaxX),
    Half is div(MaxX, 2),
    number_atom(LineN, Line),
    findall(_,(
        dots(X-Y),
        number_atom(Xn, X),
        Xn > LineN,
        X0 is LineN - Xn + Half,
        number_atom(X0, Xa),
        retract(dots(X-Y)),
        retractall(dots(Xa-Y)),
        asserta(dots(Xa-Y))
    ), _).

fold_transparency([], _).
fold_transparency(Folds, Count):-
    append(F, [Fold], Folds),
    atom_codes(Fold, [Axis, 61|Location]),
    atom_codes(Direction, [Axis]),
    atom_codes(Line, Location),
    ((Direction == x, fold_left(Line))
     ;
     (Direction == y, fold_up(Line))),
    findall(X-Y,dots(X-Y), Dots),
    length(Dots, Count),
    fold_transparency(F, _).

transparency(Records, Count):-
    make_transparency(Records, Folds),
    fold_transparency(Folds, Count),
    plot.

main:-
    open('data', read, Stream),
    read_data(Stream, Records),
    close(Stream),
    transparency(Records, _),
    halt.
The results
Notes
When first plotted the data I did not set the image size and so the default resulted in a
squared image which obscured the characters which are supposed to be visible. The
size 9, 2 part of the terminal configuration is to set an aspect ratio for easy reading
of the resulting characters. set yrange [:] reverse is necessary to re-orient the
gnuplot axis to match the axis of the puzzle data.
Anyway, I've never used popen/3 before and was very happy to find that it was so easy to
use to come up quickly with fully working solution. Especially when rushing to complete a
coding puzzle as quickly as I could. Another testament to GNU Prolog's clean design!
References
posted at: 15:42 by: Adam Russell | path: /prolog | permanent link to this entry